
Frequently asked questions
Overall context
Why do you produce the Thriving Places Index?
The Thriving Places Index (TPI) is a new measure of progress that helps make what matters count.
It’s clear that we need a new economic system, and urgently, but it’s not always clear what that new economic model would look like or how it would shape the places we live in. The TPI aims to show that clearly and comprehensively, setting out an accessible vision of what a truly thriving place looks like.
It helps us start where we are, giving us greater insight and understanding of how the places we live affect our wellbeing presently, and how they will affect the wellbeing of future generations. This clarity is an essential first step to creating a better, fairer, healthier economy that works for the people who create and populate it.
Who is it for?
The TPI measures the local conditions for wellbeing, and whether those conditions are being delivered fairly and sustainably. We gather data that is available at local authority level and produce a ‘scorecard’ for each local authority in England and Wales. At its heart the TPI is a data set and performance framework for local authorities.
It’s also a useful resources for many types of local organisations that have a stake in local wellbeing, sustainability and equality, and in contributing to the creation of a thriving place to live.
It’s also useful for large funders to help diagnose local needs and to track progress and improvement, and to link both of these things to their funding interventions.
How many local authorities do you produce scorecards for?
Have you also produced scorecards Scotland and Northern Ireland?
We are considering developing Thriving Places Scotland and Northern Ireland in future. We are always keen to develop new versions of the TPI with local partners - please get in touch via here if you are interested in working with us!
How often is the TPI updated?
We produce a TPI scorecard every year, using data collected by the end of the previous year - ie the most up-to-date data in our current 2019 TPI will have been collected in 2018.
Is it possible to compare the Thriving Places Index year-on-year?
In 2019 we made some significant improvements to the TPI to reflect the availability of new indicators, and to strengthen both the Sustainability and Equality headline elements. Because of these additions we have not published any comparisons with last year’s TPI as the new indicators mean that 2018 and 2019 are not directly comparable. In future years however we hope that year-on-year comparisons will be possible.
What are your future plans for the Thriving Places Index?
Our development work next year will be focused on strengthening the People and Community sub-domain of Local Conditions with indicators that capture subjective community cohesion, either via the inclusion of new indicators or by modelling based on questions in the Community Life Survey and British Social Attitudes Survey. We also intend to use a modelling approach to increase the number of indicators available at second tier level.
The framework
You talk about the Thriving Places Index ‘framework’. What is that?
The TPI is divided into three headline elements: Local Conditions, Sustainability and Equality. These headline elements support a broad dialogue about whether an area is creating the conditions for people to thrive, within environmental limits and in a socially just way.
Local conditions comprise the drivers of wellbeing - the things that we know have an influence on an individual’s subjective wellbeing. This includes, for example, good physical and mental health, a good job, access to green space, affordable and good quality housing, and educational opportunities.
The Local Conditions headline element shows how well a local authority is creating the conditions for people to flourish. But this doesn’t cover all of the elements of what make a place thrive. We also need to ask ‘is it being done sustainably?’ (ie without further damage to the environment/with positive environment impact) and equally, are those local conditions accessible to everyone who lives there, no matter what their race, age, gender or level of prosperity?
Overall the three headline elements produce a detailed and nuanced scorecard which shows the strengths and weaknesses in each local authority area.
Each headline element has a cluster of domains and/or sub-domains that flesh out all the different aspects of Local Conditions, Sustainability and Equality. Within these domains and sub-domains are clusters of individual indicators that provide data on each topic within the sub-domain.
Why have you not included subjective wellbeing in the Thriving Places Index?
The framework for the TPI builds heavily on research on subjective wellbeing, which is why we don’t include it explicitly in its own right. One of our key criteria in selecting indicators, and indeed defining domains, was that there should be evidence of a relationship between each indicator and subjective wellbeing, and indeed all five domains of Local Conditions correlate strongly and positively with subjective wellbeing. Furthermore, Equality includes a measure of inequality in subjective wellbeing.
The Indicators
How do you decide which indicators to use?
We select indicators that we know measure, or provide a good proxy for, something that is known to have an influence on subjective wellbeing.
Subjective wellbeing (SWB) is ‘a broad category of phenomena that includes people’s emotional responses, domain satisfactions, and global judgements of life satisfaction’ (Diener et al., 1999: p. 277). Specifically, reported SWB consists of two distinctive components (cf. Diener, 1994: p. 106): an affective part, which refers to both the presence of positive affect (PA) and the absence of negative affect (NA), and a cognitive part. The affective part is a hedonic evaluation guided by emotions and feelings, while the cognitive part is an information-based appraisal of one’s life for which people judge the extent to which their life so far measures up to their expectations and resembles their envisioned ‘ideal’ life.
The indicator data topic must also be something that it is within the remit of a local authority to influence through policy and action. In addition the indicators have to be available at upper tier English local authority level, and where possible at second tier level (and at council level in Wales) with a reputable source (usually a national data agency) and robust and reliable sample size and representativeness. Indicators should be updated regularly, preferably every one or two years.
We have a checklist against which we rate each indicator, so we are clear that it qualifies for the index and also what its strengths and weaknesses are:
- Availability
- Related to subjective wellbeing
- Validity
- Regularly updated
- Amenable to local action
How many indicators are there?
The English second tier framework has 44 indicators in total.
The Welsh framework has 54 indicators in total.
The variations are down to the availability of data at the relevant local authority level.
Does it matter that the indicators come from datasets that have been collected at different times?
We prefer to use very recent data sets, but not all data agencies update their data annually or even bi-annually, so we include a handful of indicators where the most up-to-date version is 2011 census data, for example. We label the date of the data set very clearly on our indicator spreadsheet LINK . This is the upper tier date breakdown for 2019, which shows that 60% of our indicators date between 2016-2018, and only 18% predate 2015:
|
Data currency: annual time frame |
Number of indicators |
|
2018 |
2 |
|
2017 |
11 |
|
2016 |
10 |
|
2015 |
2 |
|
2014 |
0 |
|
2013 |
1 |
|
2012 |
1 |
|
2011 |
5 |
|
Data currency: two year time frame |
|
|
2017-2018 |
2 |
|
2016-2017 |
13 |
|
2015-2016 |
1 |
|
2014-2015 |
3 |
|
2008-2012 |
1 |
|
Data currency: > two year time frame |
|
|
2015-2017 |
2 |
|
2014-2017 |
1 |
|
2014-2016 |
4 |
|
2011-2013 |
1 |
|
2009-2013 |
1 |
|
2008-2012 |
1 |
|
TOTAL |
62 |
Does each sub-domain have the same number of indicators?
No - the Local Conditions headline element is much broader than the Sustainability and Equality elements. At England upper tier level it contains 50 indicators, spread across the five domains and 17 sub-domains. At England second tier level it contains 37 indicators and in Wales 42. Across the TPI we aim to minimise the number of single indicator sub-domains as a more nuanced perspective on the sub-domain topic is more useful. The Local Conditions element of the English upper tier TPI is broken into domains and sub-domains as follows:
|
Domain |
Sub-domain |
Number of indicators |
|
Place and Environment |
Local Environment Transport Safety Housing |
5 5 3 4 Total: 17 |
|
Mental and Physical Health |
Healthy and risky behaviour Overall health status Mortality and life expectancy Mental health |
3
5 3 4 Total: 15 |
|
Education and Learning |
Adult education Children’s education |
3 3 Total: 6 |
|
Work and Local Economy |
Unemployment Employment Local business Basic needs |
1 1 1 3 Total: 6 |
|
People and Community |
Participation Community cohesion Culture
|
4 1 1 Total: 6 |
The scorecard
Can you explain your scoring formula?
You can read our full methodology here.
First we collect data for each indicator (sometimes this involves a calculation). We then find the average for England for each variable, and the standard deviation between local authorities within England. In most cases, the England average is available from the same source as the data for individual local authorities. Where this wasn’t the case we calculated the average by taking a weighted (by population) average of all local authorities. This was the case for 50 indicators. We used the 2018 England average for the 12 indicators that use the same data as last year.
We then calculate the z-scores for each indicator for each local authority, subtracting the mean for England and dividing by the standard deviation between the local authorities:
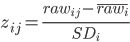
where rawij indicates the original indicator value for indicator i for LA j, etc. Where necessary indicators are reversed so that positive numbers are better than average.
Calculating z-scores allow us to compare a local authority’s performance on two indicators even if they are measured on different scales. So if an local authority scores -1.0 on one indicator, and -2.0 on another, then it means that it is 1 standard deviation below the English mean for the former, but 2 standard deviations below the mean for the latter – indicating that the second indicator may be more of a priority for the local authority.
Note that, in future years, to allow comparison over time, it will be possible to calculate ‘pseudo z-scores’ where the data for new years is benchmarked against the mean and standard deviation from this first Thriving Places Index. That means that while for 2019, the average z-score for any indicator is by definition 0, in future years, the average could rise or fall.
Combining
We average all indicators within each subdomain first. In almost all cases, all indicators are given the same weighting. We then average all subdomains within each domain. Note that we have two measures of wellbeing inequality, so these are averaged together, before combining them with the other two measures of inequality. We then average for all the domains for the Local Conditions to create a Local Conditions score.
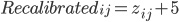
Calibrating
z-scores are hard to interpret for most people. We convert them to a scale that runs between 0 and 10, with 5 indicating the average for England. A 10 on this scale indicates an exceptionally good score, and a 0 indicates an exceptionally poor score. Each z-score was multiplied by 5/3 and then 5 was added, as shown below:
Presentation
As well as calculating 0-10 scores, we also devised a colour scheme for presenting scores. These are shown below.
The thresholds were chosen to ensure a reasonable spread across the colours. So for example, 15% of sub-domain scores are in the bottom category, 21% in the second category, 29% in the third category, and so on.
|
Score |
Label |
|
< 3.5 |
Lowest |
|
3.5 - 4.5 |
Low |
|
4.5 - 5.5 |
Average |
|
5.5 - 6.5 |
High |
|
> 6.5 |
Highest |
Is it possible to get a minus score or a score greater than ten?
A 10 on our scale indicates an exceptionally good score, and a 0 indicates an exceptionally poor score. Scores above 10 were capped at 10 and those below 0 were capped at 0. The formula was designed purely to ensure a reasonable spread of scores between 0 and 10. Any variation more than three standard deviations away from the mean is ignored. The implication is that any variation beyond a certain range is fairly irrelevant. Out of the 9,446 sub-domain scores for the 150 local authorities, only 138 z-scores fell beyond the ±3 range, and were therefore capped.
How can I use the Thriving Places Index
Please see the page ‘Using the Thriving Places Index’ for detailed information about applying the framework.
How do I get involved?
Please see the page ‘Get involved’ for more information.